This is a public accounting of Paycheck Protection Program loans
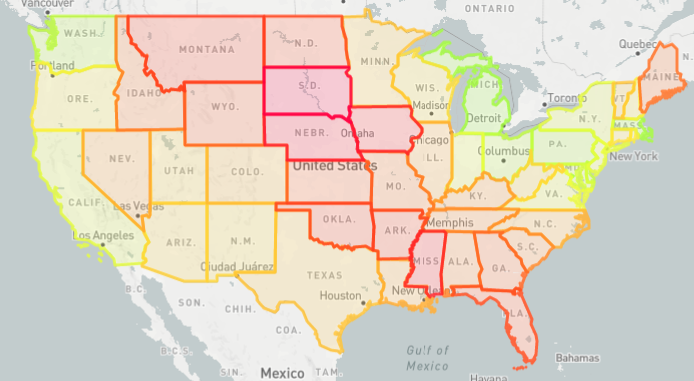
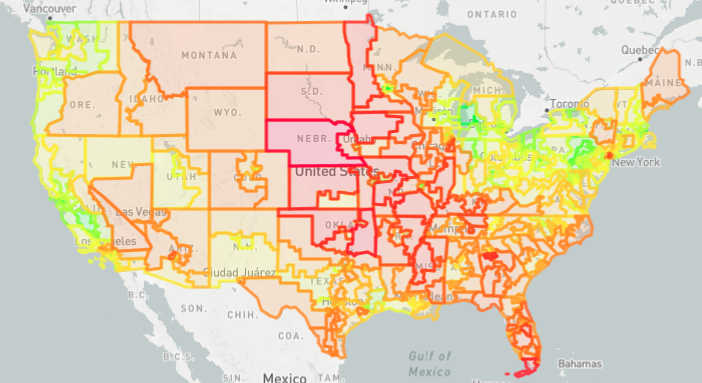
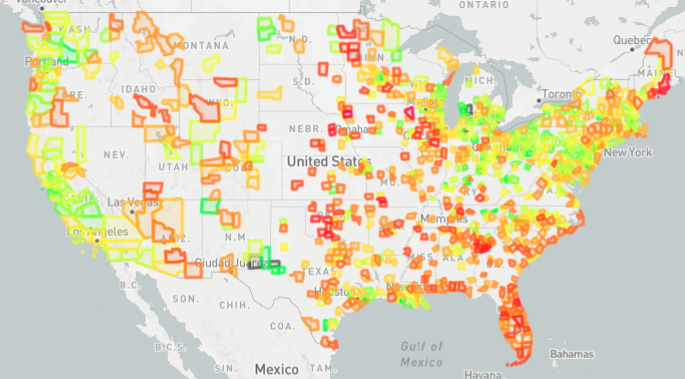
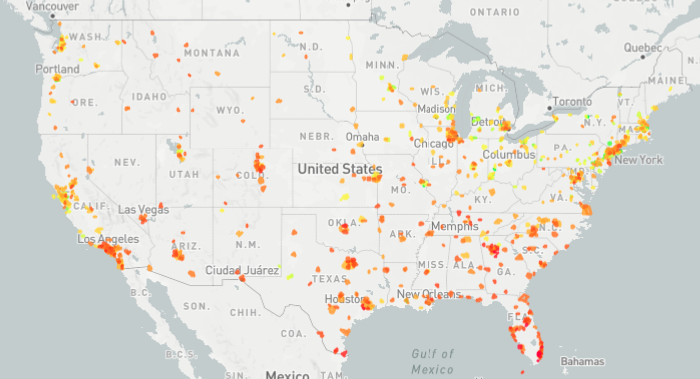
As of January 2nd, 2022, the program has been allocated nearly $1 trillion dollars in taxpayer funds, and guaranteed $792.6 billion dollars in forgivable loans to small businesses. This interface makes it easy for anyone to see where the money went.
The Small Business Administration, which administers this program, fought against the release of detailed information until litigation by the media compelled the release of the full dataset including exact loan amount and the exact number of jobs the loan was intended to preserve.
- ProPublica's PPP viewer has independently computed the same results
- Wikipedia article on PPP
- SBA Official Website
-
Total loans $792.6B
Total in small loans < $150k (35%) $278.7B
Total in large loans > $150k (65%) $513.9B
-
Total forgiven $663.9B
Total in small loans < $150k (35%) $233.4B
Total in large loans > $150k (65%) $430.4B
-
Number of loans 11,469,801
Small loans < $150k (92%) 10,501,263
Large loans > $150k (8%) 968,538
-
Number of jobs 89,860,318
For small loans < $150k (44%) 39,604,952
For large loans > $150k (56%) 50,255,366
- Loans by industry
-
Loan date/location
next update
Adds more detailed information to loan results.
-
Loans by ZIP code
next update
Search cities, industries, and loans by ZIP code.
-
US territories/dependencies
next update
Include loans to Puerto Rico, Guam, and 4 others.
- FUTURE ROADMAP
-
EIDL loans
Include the public dataset of Economic Injury Disaster Loans, and correlate to PPP loan recipients.
-
Loans by lender
Aggregate loans by lender ID, to show which regions and industries that each lender and sub-lender was most active in.
-
Loans by date
Aggregate loans and industries by loan type (first or second) over time, to see when certain industries and regions were most impacted.
-
Race/gender statistics
Some loan applications answered gender/race questions, but a majority did not. When displaying aggregated statistics about race, the visualization should correctly show the proportion of unanswered responses.


